How to Read a Histogram (And Why It's More Reliable Than Your LCD Screen)
Every student at Zyamaru Films Academy eventually learns this the hard way: a photo that looks perfectly exposed on the camera's LCD screen can turn out badly overexposed once you view it properly on a computer. The screen lied — not on purpose, but because LCD brightness, screen glare, and even the ambient light around you all distort what you're actually seeing.
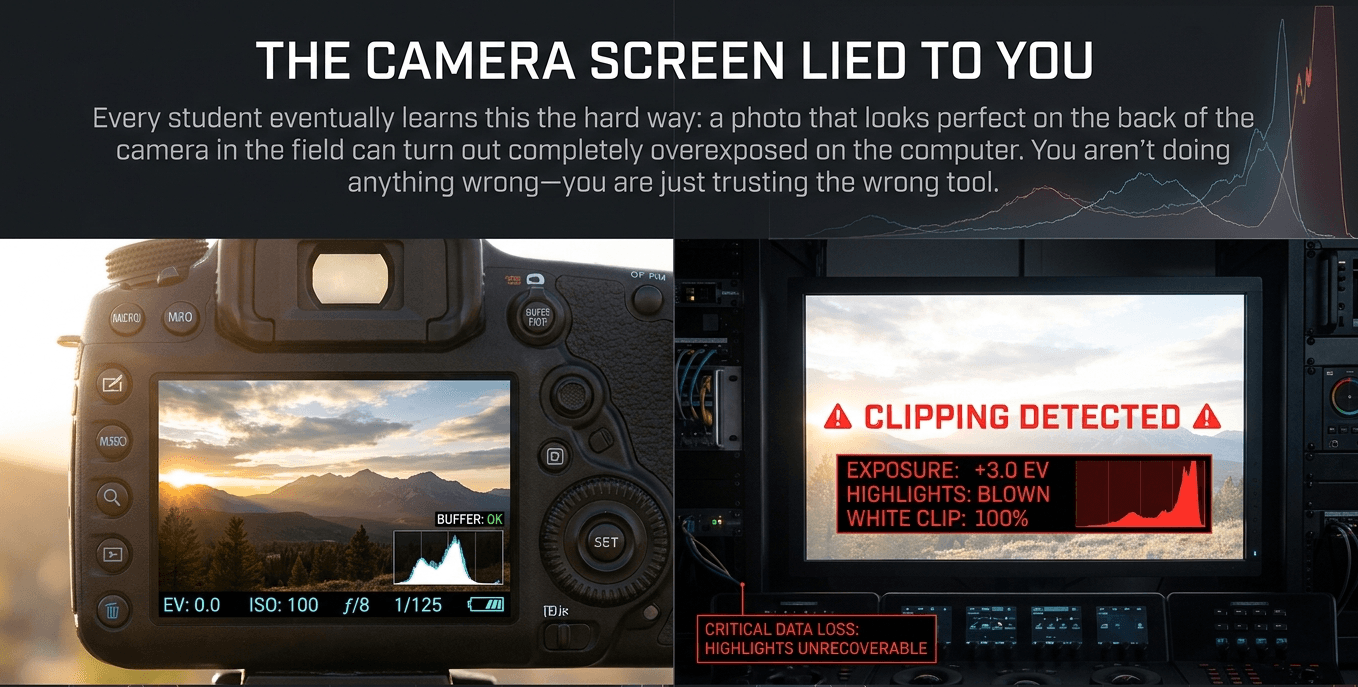
The histogram doesn't lie. It's a small graph, tucked into your camera's playback or live view screen, that shows you the actual distribution of tones in your photo — and once you can read it, it becomes far more reliable than your eyes for judging exposure in the field.
What a histogram actually shows
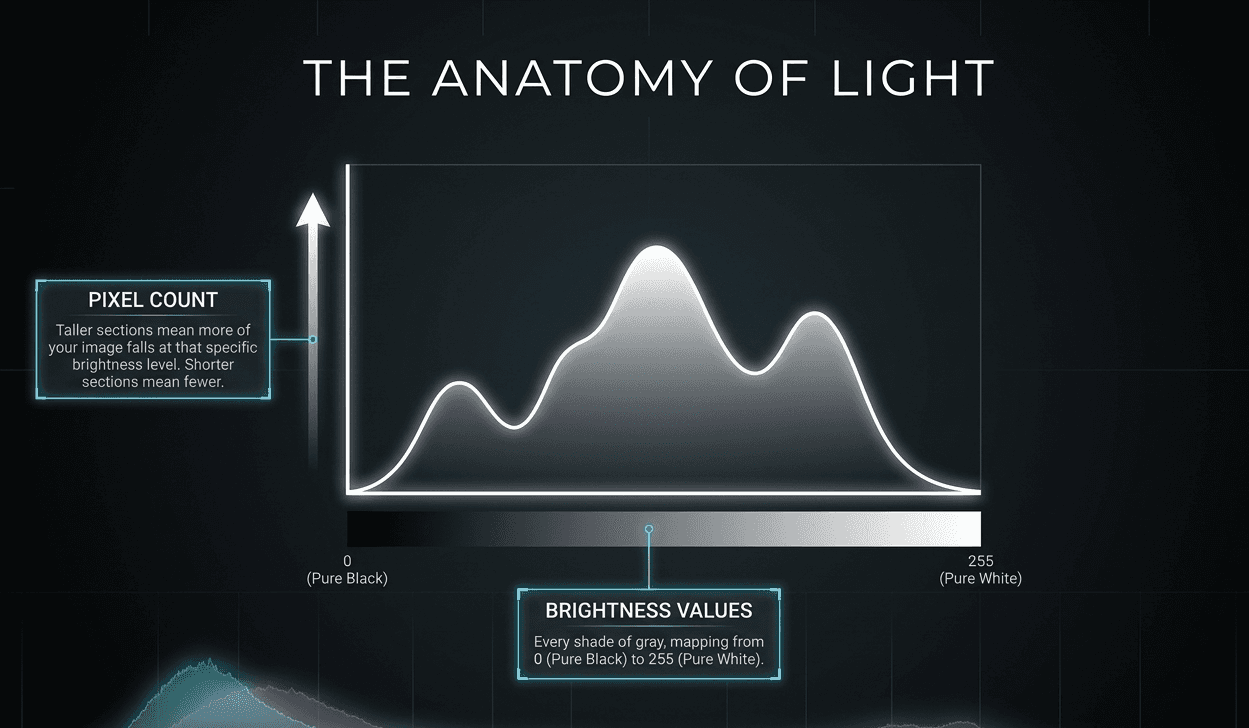
A histogram is a graph with brightness along the horizontal axis — pure black on the far left, pure white on the far right, with every shade of gray in between — and the number of pixels at each brightness level shown as height on the vertical axis. Taller sections mean more pixels in your photo fall at that brightness; shorter or empty sections mean fewer.
The five zones, left to right
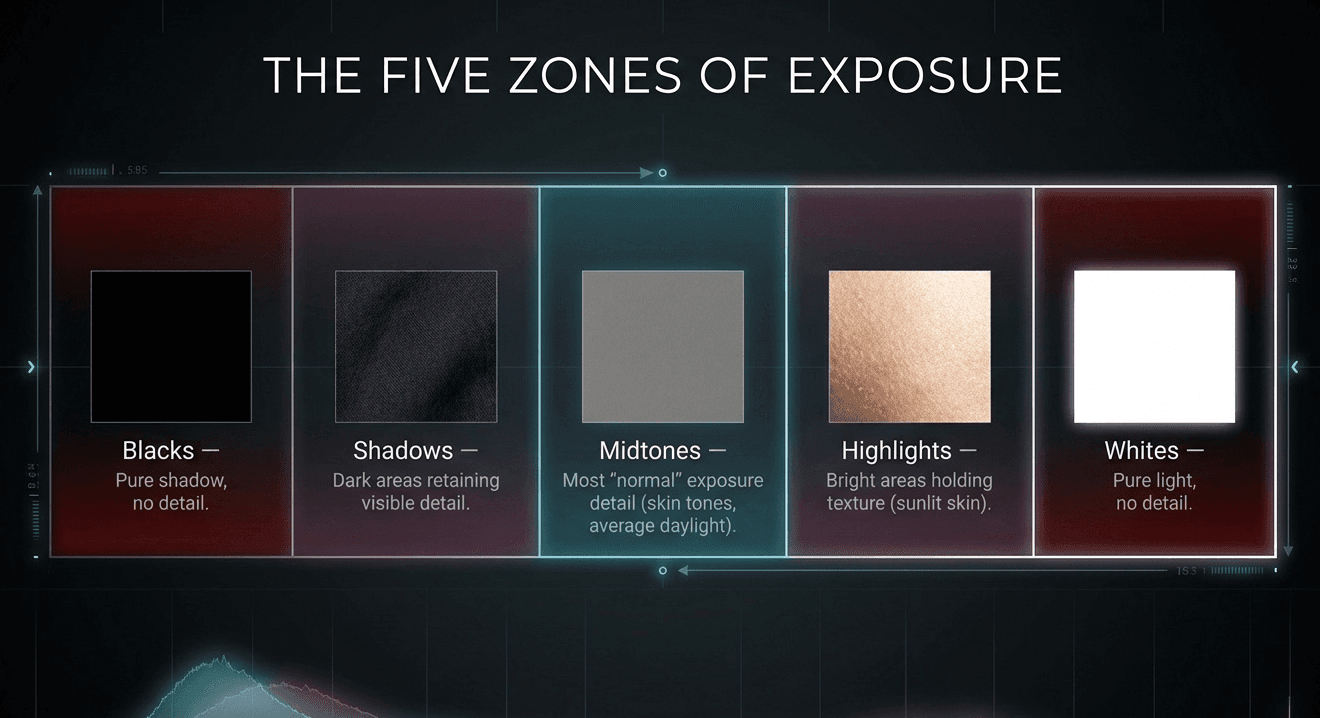
- Blacks — the darkest possible tones, pure shadow with no detail
- Shadows — dark areas that still retain some visible detail
- Midtones — the middle range, where most "normal" exposure detail lives — skin tones, average daylight scenes
- Highlights — bright areas that still hold detail, like sunlit skin or a bright sky with visible texture
- Whites — the brightest possible tones, pure light with no detail
A well-balanced photo of an average scene usually shows a histogram with the bulk of its data comfortably within these zones, without piling up hard against either edge.
Why the edges matter more than anything else: clipping
The single most important thing to watch for on a histogram isn't the shape of the curve — it's whether data is touching or piling up at the far left or far right edge. This is called clipping, and it means that part of your image has lost detail permanently. A pixel clipped to pure white can't be recovered as "slightly less bright" in editing — the actual brightness information is simply gone, replaced with flat, featureless white. The same is true of pure black clipping on the shadow side.
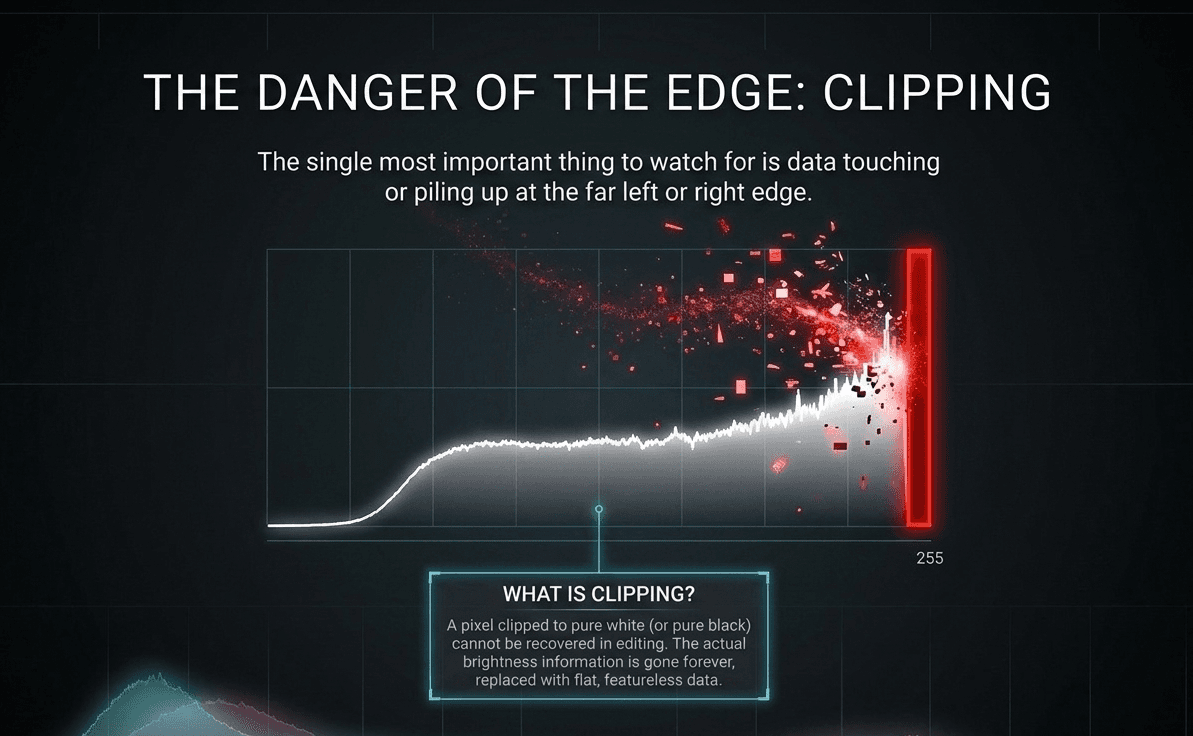
This is exactly why the histogram is more trustworthy than your LCD screen: a bright outdoor screen combined with your camera's automatic screen brightness can easily make a genuinely clipped, overexposed sky look "fine" to your eyes in the moment, while the histogram shows you plainly that the right edge is spiking hard against the wall.
Reading three common histogram shapes
A histogram bunched toward the left edge, with a gap on the right usually means your photo is underexposed — most of the tonal information sits in the shadows and midtones, with little to nothing in the highlights. This is common when shooting into shade without adjusting exposure compensation.
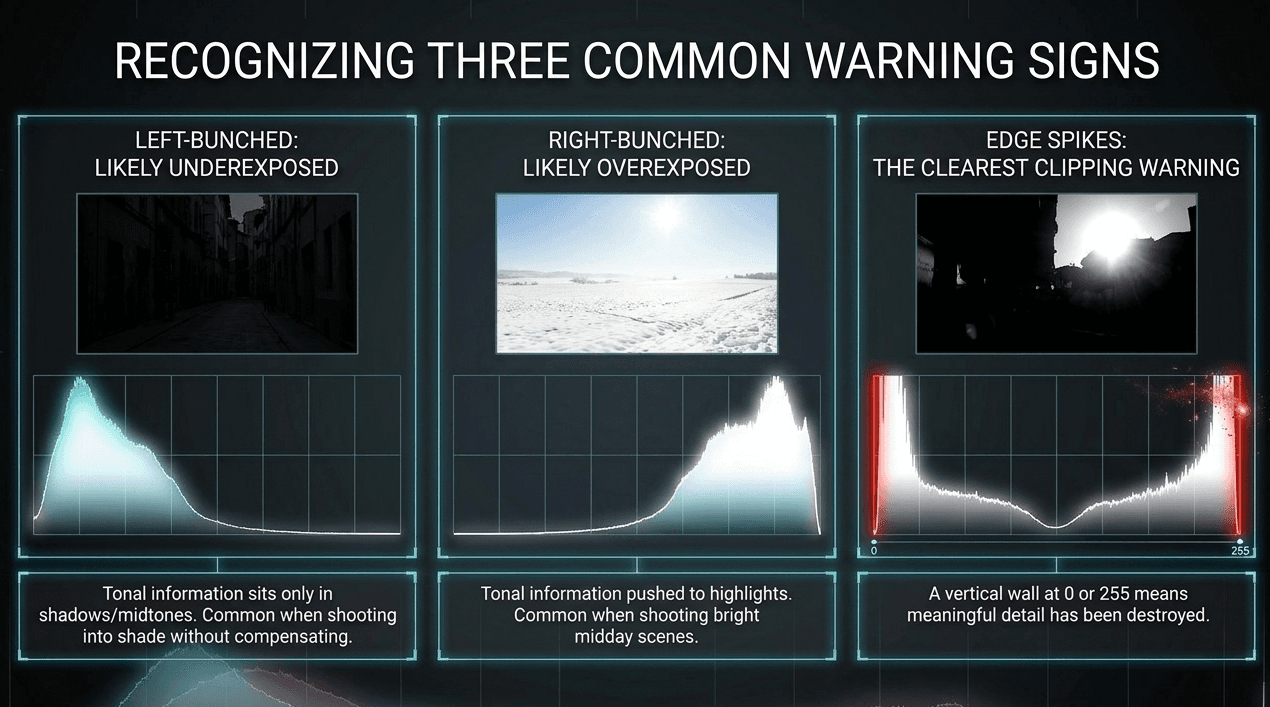
A histogram bunched toward the right edge, with a gap on the left, especially spiking against the right wall usually means your photo is overexposed, with highlight detail clipped to pure white — a frequent problem shooting bright scenes like snow, white walls, or a midday sky without compensating.
A histogram with a tall spike hard against either edge is the clearest clipping warning of all — a vertical wall of pixels stacked at 0 or 255 means a meaningful portion of your image has permanently lost detail in that zone.
There's no single "correct" histogram shape
This is a genuinely important nuance beginners often miss: a good histogram doesn't always look like a smooth, centered curve.
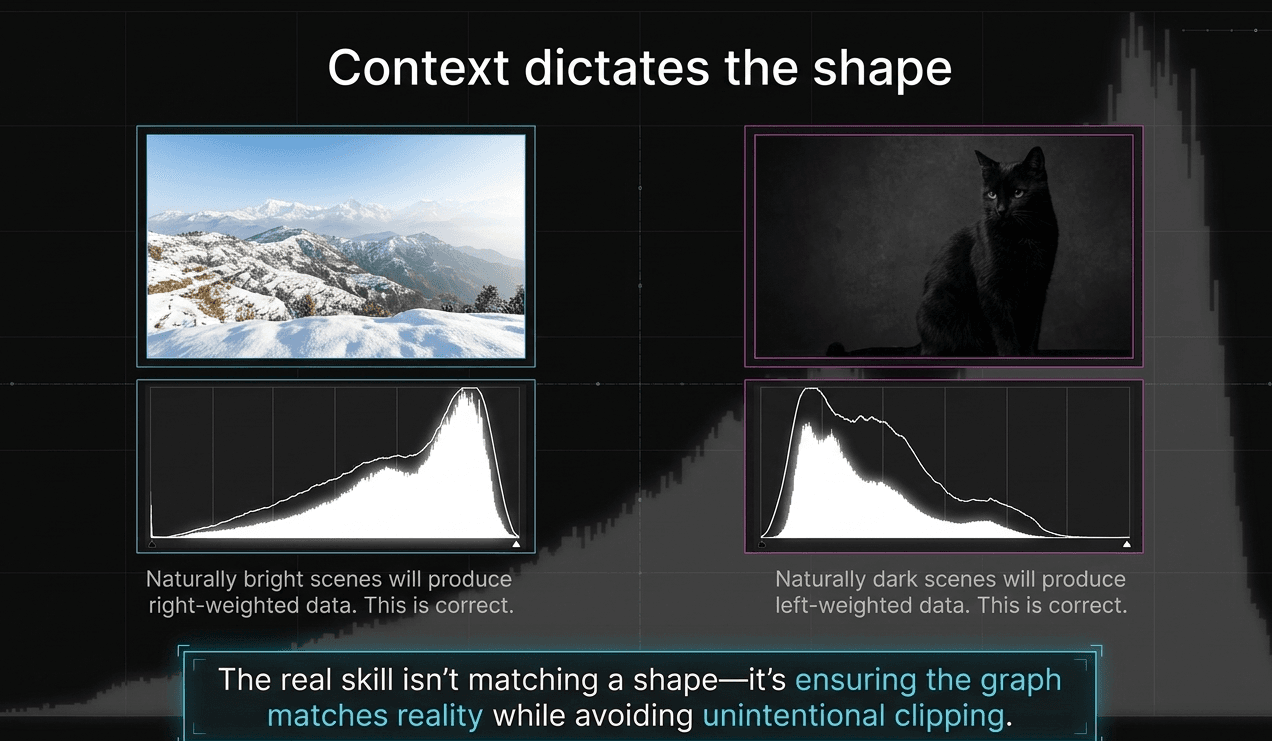
A photo of a black cat against a dark background will naturally have a histogram weighted heavily to the left — and that's correct for that scene, not a sign of underexposure. A photo of snow-covered Nagarkot hills will naturally weight heavily to the right. The real skill isn't matching some "ideal" bell-curve shape — it's understanding whether the histogram's shape matches what the scene actually contains, and watching for unintentional clipping at either edge.
How to use the histogram while shooting
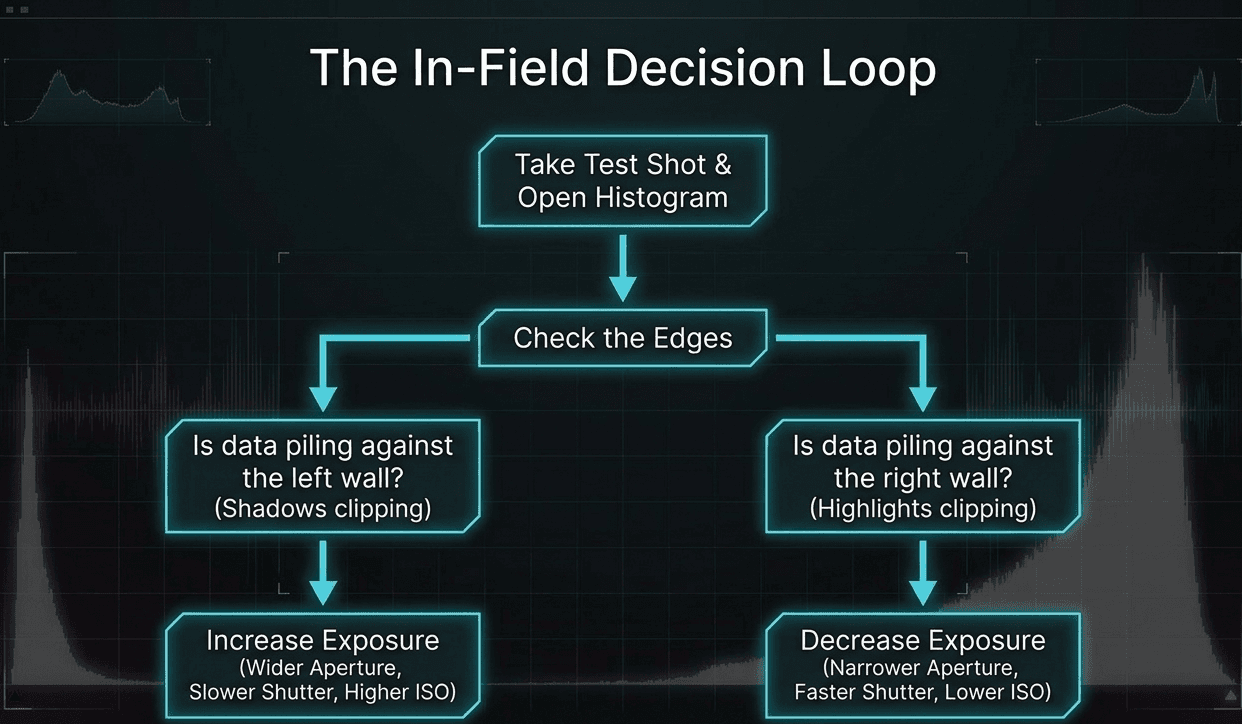
- After a test shot, pull up the histogram in playback (check your camera's menu or display button if you're not sure where it appears)
- Check both edges first — is data piling up against the left or right wall?
- If highlights are clipping and you want to preserve that detail, reduce exposure — narrower aperture, faster shutter speed, or lower ISO
- If shadows are clipping and you want to preserve that detail, increase exposure — wider aperture, slower shutter speed, or higher ISO
- Remember: as covered in the RAW vs JPEG post, a RAW file gives you meaningfully more room to recover near-clipped (though not fully clipped) highlight and shadow detail in editing than a JPEG will
A common beginner mistake: chasing a "perfect" centered histogram
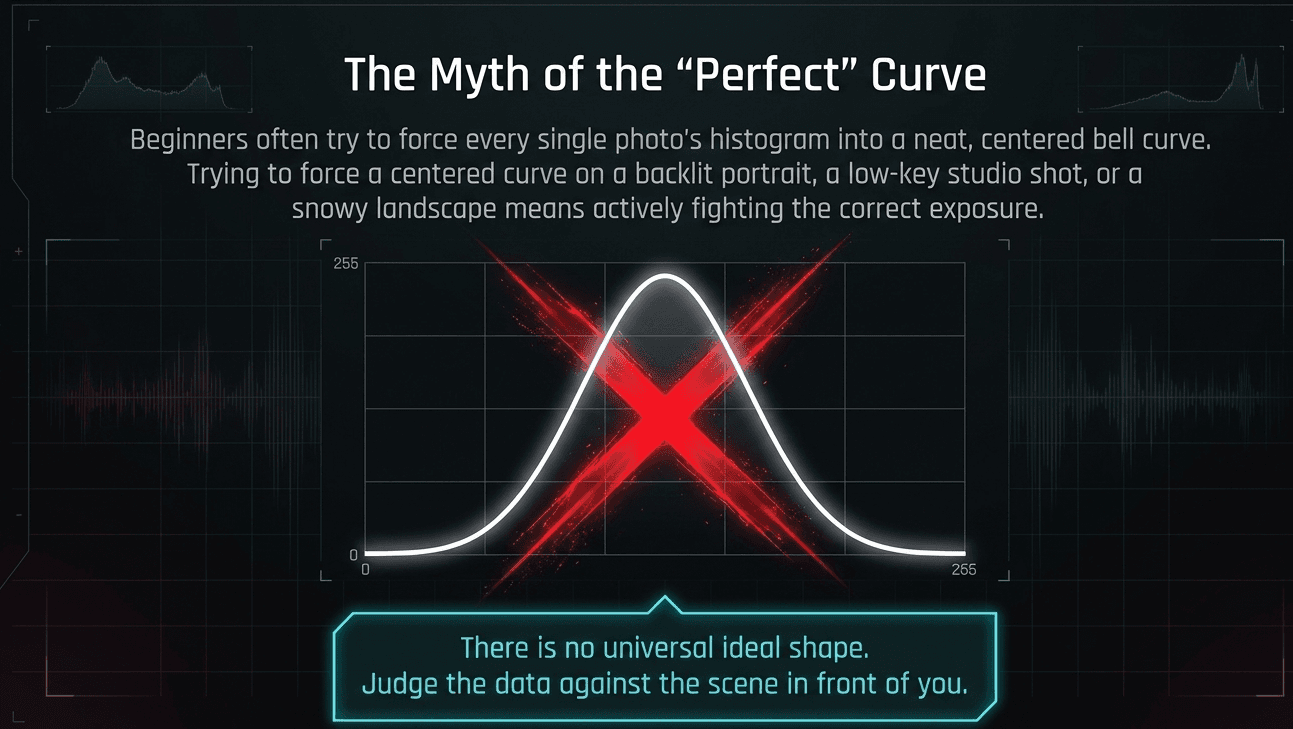
Some new students try to force every single photo's histogram into a neat, centered bell curve, regardless of the actual scene. A backlit portrait at golden hour, a low-key studio shot, a bright snowy landscape — none of these should produce a centered histogram, and trying to force one usually means actively fighting the correct exposure for that particular scene. Judge the histogram against the scene in front of you, not against some universal ideal shape.
What comes next in this module
- Common Exposure Mistakes Beginners Make — the closing post of Module 2, rounding up the most frequent errors before we move into Module 3: Composition & Framing
Learn to read exposure in the field at Zyamaru Films Academy

Checking a histogram genuinely becomes second nature after enough real shoots — glancing at it between shots the same way you'd check a rearview mirror while driving. Our Basic photography course, Photography to Cinematography course at Zyamaru Films Academy in Tahachal, Kathmandu builds this habit directly into every hands-on session, guided by an industry-active cinematographer who reviews exposure decisions with students in real time.
Turn Passion Into Profession.
Frequently asked questions
Why does my photo look fine on the camera screen but overexposed on my computer?
LCD screens are affected by their own brightness settings and by ambient light around you, both of which can make a genuinely overexposed or clipped photo appear correctly exposed in the moment. The histogram isn't affected by any of this, which is why it's the more reliable tool.
Is a centered histogram always the correct exposure?
No. The correct histogram shape depends entirely on the scene — a naturally dark or naturally bright subject will produce a histogram weighted toward one side, and that's appropriate, not a mistake. The main thing to watch for is unintended clipping at either edge.
Can I recover clipped highlights or shadows in editing?
Generally, no — true clipping means the actual brightness data was never recorded, so there's nothing left to recover. Near-clipped areas, especially in RAW files, often do have some recoverable detail, which is why staying just short of the histogram's edges gives you the most flexibility later.